U.S. dollar and U.S. debt cover risk aversion support, and gold jumps up and down under pressure

Tuesday of the last trading day (July 20): International gold London gold rushed higher and fell back and then closed down. Although Monday’s bottoming and rebounding strength continued, but it is difficult to last. The market once again encountered resistance near the 200-day moving average given the target level. Therefore, this wave of rising and falling should also continue to a certain extent. The following will pay attention to the middle rail again. And support near the 100-day line. A break will further lower to around $1770, but if the support rebounds again, the top will continue to pay attention to the 200-day moving average resistance, and the breakthrough can be further bullish upward.
In terms of trend, the price of gold opened at US$1812.76 per ounce since the Asian market in the early trading, and then it moved higher first due to the bottoming and rebounding force of the previous day. Although it fell back at the end of the market, investors were still concerned about the rapidly spreading variant virus after the European market. Feeling worried, and will restrain global economic growth, support the price of gold to rebound higher again, and continue to the early evening US market recorded an intraday high of US$1824.72;
But here is also encountering resistance to the 200-day moving average. Coupled with the opening of the Dow, due to a series of optimistic corporate financial reports and renewed optimism about the economy, it rose sharply and closed in the sun. The dollar climbed to a three-month high. U.S. Treasury yields rebounded sharply from their daily lows, which restrained the inflow of funds into gold. Since then, gold prices have fallen sharply and recorded an intraday low of $1,804.85. However, the U.S. dollar index subsequently fell from the high point. Technically, The price of gold was also affected by the 10-day moving average and trend line to support buying orders, and it stopped falling and rebounded, but eventually closed at US$1810.07, with a daily amplitude of US$19.87, and closed at US$2.69, a decrease of 0.15%.
Looking forward to today’s Wednesday (July 21): The international gold market opened, as the US dollar index continued to move strongly, that is, continuing the strength of Tuesday’s rise and fall, but the US bond yields have stopped relative to the overnight rebound and limited its gold price decline. Judging from yesterday's closing line this week, U.S. debt still has room for a rebound this week, so the trend is still rising at the end of the week, and gold prices are still facing the risk of pressure. Silver is more responsive to pressure.
Fundamentally, although the coronavirus infection cases in the United States and other countries have surged in recent trading days, which has stimulated some safe-haven buying of gold, the US dollar has continued to strengthen and rose to a three-and-a-half-month high. Attractive. At the same time, the U.S. 10-year Treasury bond yield rebounded to above 1.20% and pressured gold.
However, with the emergence of inflation or potential stagflation and variants of the new crown virus, gold may go higher, especially when bond yields are at such low levels. In addition, because central banks are still net buyers of gold, and consumer demand has risen after the reopening of Indian stores, there is room for physical demand to buffer the downward trend in gold.
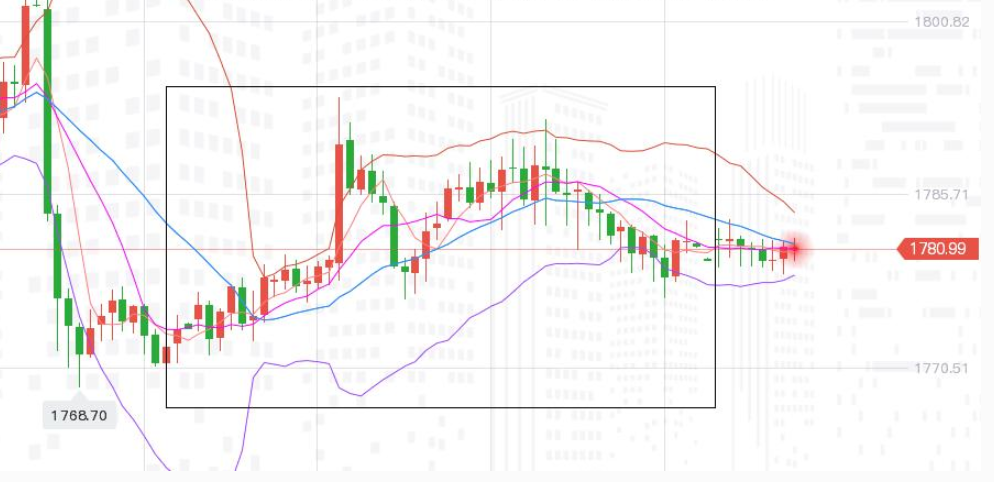
In general, the short-term trend of gold prices tends to oscillate within the 100-200-day moving average that has been mentioned before, and we will continue to pay attention to the epidemic and the impact of the US dollar on gold prices.
Technically, weekly level: The price of gold has bottomed out this week, and it has also risen. Compared with last week, the price of gold continues to fluctuate. The upper 10-week moving average puts greater pressure on it, but there is relatively strong support near the lower middle rail. The bearish power areas of KDJ and MACD indicators in the attached figure are stable, and there is no obvious strengthening or weakening, suggesting that the short-term market is still biased towards volatility.
In the longer term, on the main chart, the 50% retracement line and the 100-week moving average have strong support. Combined with the overall trend from the high of $2075 to the present, there is a market that has emerged from the bottom of the arc. Therefore, the price of gold will be in the future. Return to the expectations and space near the two thousand mark.
Continue to use the 50% retracement line (1762) and the 100-week moving average (1735) as buying support below, and focus on the target resistance of US$1900 and US$1970. However, in the short term, we still need to pay attention to the trend of daily chart market.
Daily level: The price of gold first bottomed out this week and then rose back down, adding to the recent volatility. However, judging from the indicator signals and the doji peaking signal on the main chart last week, gold has a high probability of oscillating. Under pressure, the 200-day moving average will continue to be used as resistance at the top, and the 100-day moving average will continue to be supported at the bottom to maintain range trading. No matter which side is broken, take advantage of the trend to see further target positions. The daily short-term focus is on the market of 4 hours and below. The specific order and ideas are subject to the actual warehouse information.
International gold: below, pay attention to the support of 1801 US dollars and the support near 1796 US dollars; above, pay attention to the resistance near 1816 US dollars and 1823 US dollars.